
CPU usage
- Thread starter andycots
- Start date
I have the same problem. I'm pretty sure that it's a bug with how BI calcluates / probes CPU usage.
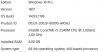
I have BI (and nothing but BI) running on an dedicated server - Dell R210 II, Windows Server 2016 Datacenter, Xeon E3-1280 V2 @ 3.6GHz (4 physical cores, 8 logical). 16GB of mem.
At present, the server has two 1GBps NICs bonded into an LACP team connected to a Catalyst 3560G. The box is servicing (at present) eight 5MP IP cams set at H265 / 1080P & 15 fps. They all connect to a Catalyst 3560-8 which further connects via gigabit fiber to to the same 3560G that the server lives on. Bottom line - overpowered box for what it's doing and a ton more network bandwidth than the cameras can possibly fill up.
The BI box is doing direct to disk recording / no reencoding.
I just checked, and BI was reporting 57% CPU usage. Task Manager reports 25%, and the cores are running at less than half of maximum frequency (44%), while Resource Monitor says that BI is 50%.
What I think that this means:
Resource Monitor is reporting that BI comprises 50% of all CPU usage in that snapshot. It doesn't represent processor load, but instead what percentage of active load a given process represents.
Short version: the processor group is actually running at 25%, and at less than half of maximum speed (SpeedStep slows the cores down when the additional horsepower isn't needed), and BI represents 50% of that 25% load. That calculates to BI itself causing a 12.5% load on the processors.
BI is reporting the percentage of processor load that is is causing, not the actual percentage of processor load. I would go with the Task Manager numbers ignore the percentage displayed by BI. IMO it's meaningless.
Attachments
-
 82.5 KB Views: 13
jranalletta
Young grasshopper
- Joined
- Dec 20, 2014
- Messages
- 51
- Reaction score
- 3
BI, latest version (4.5.7.2 x64) No changes in CPU or cams. Supporting 2 Sharx only.
Indicated CPU will range into 90-100%
Any suggestions appreciated.
Indicated CPU will range into 90-100%
Any suggestions appreciated.
fenderman
Staff member
- Joined
- Mar 9, 2014
- Messages
- 36,902
- Reaction score
- 21,274
what was it before? what cpu?BI, latest version (4.5.7.2 x64) No changes in CPU or cams. Supporting 2 Sharx only.
Indicated CPU will range into 90-100%
Any suggestions appreciated.
make sure direct to disk is enabled for BOTH cams
jranalletta
Young grasshopper
- Joined
- Dec 20, 2014
- Messages
- 51
- Reaction score
- 3
Direct to disk enabled in both cameras.
CPU normally ranges from 20-30% (as it is at this time)
Thanks...
CPU normally ranges from 20-30% (as it is at this time)
Thanks...
jranalletta
Young grasshopper
- Joined
- Dec 20, 2014
- Messages
- 51
- Reaction score
- 3
also, running BI as a service.
jranalletta
Young grasshopper
- Joined
- Dec 20, 2014
- Messages
- 51
- Reaction score
- 3
fyi...BI this morning

aristobrat
IPCT Contributor
- Joined
- Dec 5, 2016
- Messages
- 2,983
- Reaction score
- 3,180
jranalletta
Young grasshopper
- Joined
- Dec 20, 2014
- Messages
- 51
- Reaction score
- 3
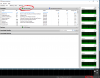
This image captured when CPU usage = 75%. Now ranging between 40-90%

aristobrat
IPCT Contributor
- Joined
- Dec 5, 2016
- Messages
- 2,983
- Reaction score
- 3,180
It looks like the Memory column is sorted. Would you be able to sort by the CPU column?
jranalletta
Young grasshopper
- Joined
- Dec 20, 2014
- Messages
- 51
- Reaction score
- 3
Without iTunes, still get brief spikes. With iTunes running, many more and spikes into 90%+.
This view CPU at 94% after starting iTunes and with BI suspended.

This view CPU at 94% after starting iTunes and with BI suspended.
Hound Dog 911
Getting comfortable
- Joined
- Jan 30, 2017
- Messages
- 835
- Reaction score
- 320
Best practice IMO is to run BI on its own dedicated box.Without iTunes, still get brief spikes. With iTunes running, many more and spikes into 90%+.
This view CPU at 94% after starting iTunes and with BI suspended.
View attachment 19061
jranalletta
Young grasshopper
- Joined
- Dec 20, 2014
- Messages
- 51
- Reaction score
- 3
I get that, but it's been running well on my desktop. Something changed, just don't know what.Best practice IMO is to run BI on its own dedicated box.
looney2ns
IPCT Contributor
Revert back a version or two.I get that, but it's been running well on my desktop. Something changed, just don't know what.
aristobrat
IPCT Contributor
- Joined
- Dec 5, 2016
- Messages
- 2,983
- Reaction score
- 3,180
From post #2 above, it sounds like the way BI calculates and displays the CPU usage within the app isn't always accurate on some systems. As long as Windows Task Manager isn't also showing that BI is using 95% of the processor, maybe something did change in the last version or two of BI.I get that, but it's been running well on my desktop. Something changed, just don't know what.