I'm running Blue Iris on an older system with the following specs:
I had a few issues in the past due to insufficient cooling, which ultimately led to CPU failure. After replacing the processor twice, I upgraded the cooler to a Peerless Assassin 120 SE V3 — which just fits in the 4U rack case. Since then, the system has been running reliably.
I’m currently managing a mix of Dahua, Hikvision, and some older (soon-to-be-replaced) Foscam cameras. All are set to 15fps, recording only on alerts, confirmed with CodeProject.AI, with ONVIF triggers used on the Dahua models.
This setup shows that with proper configuration and a bit of optimization — much of which I’ve learned thanks to this forum — even an older system can handle a decent load very well.
Since replacement CPUs are getting harder to find, I wanted to make sure the upgraded cooling solution was actually doing its job. So I finally set up proper monitoring using:
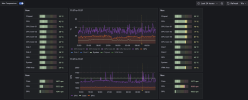
Here’s a screenshot of my current dashboard. I’ll be adding more panels soon for CPU/GPU load, disk usage, and other metrics. So far, the performance looks very reasonable considering the age and specs of the system.

Would love to hear what others are doing for monitoring, cooling, or similar setups!
- Case: 4U Rackmount
- Motherboard: Gigabyte Z97X-UD3H-CF
- CPU: Intel i7-4790K
- RAM: 24GB
- GPU: GeForce GTX 1060 6GB
- OS: Windows 10 (on SSD)
- Storage: 2 x HDDs
I had a few issues in the past due to insufficient cooling, which ultimately led to CPU failure. After replacing the processor twice, I upgraded the cooler to a Peerless Assassin 120 SE V3 — which just fits in the 4U rack case. Since then, the system has been running reliably.
I’m currently managing a mix of Dahua, Hikvision, and some older (soon-to-be-replaced) Foscam cameras. All are set to 15fps, recording only on alerts, confirmed with CodeProject.AI, with ONVIF triggers used on the Dahua models.
- Cameras: 16 (mostly 4MP)
- Throughput: ~80 MP/s, ~12,000 KB/s
- Inference times (CodeProject.AI): ~46ms average
This setup shows that with proper configuration and a bit of optimization — much of which I’ve learned thanks to this forum — even an older system can handle a decent load very well.
Since replacement CPUs are getting harder to find, I wanted to make sure the upgraded cooling solution was actually doing its job. So I finally set up proper monitoring using:
- Telegraf + Open Hardware Monitor + Open Hardware Monitor Telegraf plugin on the Windows machine
- InfluxDB and Grafana running in Portainer on my Synology NAS
Here’s a screenshot of my current dashboard. I’ll be adding more panels soon for CPU/GPU load, disk usage, and other metrics. So far, the performance looks very reasonable considering the age and specs of the system.

Would love to hear what others are doing for monitoring, cooling, or similar setups!
