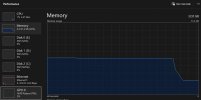
Running on Windows 11 Pro, running about 40 streams through CP.AI, after enough time & events, the memory use of the CodeProject.AI Server through Task Manager still shows only ~150MB on the process tab, BUT the total memory use shown on the performance tab grows over time to 10-15GB at which point I either have to restart the service or bad things happen. When I use the services window to restart "CodeProject.AI Server", the system memory use drops by that 10-15GB, indicating that the memory lost is within CodeProject.AI. Here are two screenshots showing the stated memory usage, and then the memory usage after stopping the CodeProject.AI Server after about 440k calls to the Object Detection (v1.14.0), and 77k calls to the License Plate Reader (3.3.4).


Having said that, I realize it's possible this is due to BlueIris' interaction with it, perhaps not freeing up connections, BUT then I would expect the process memory use to show growth as well.
The 10GB+ memory growth typically happens over the course of a week or more, but when the winds are blowing causing lots of false activations, it can happen in just a few days. At a minimum, it does seem directly proportional to the number of calls to CP.AI. I have a second instance of BI with only 4 cameras and never see this kind of growth.
Has anyone else experienced this? Are there specific lines in the CP.AI log file that I can try to match up (e.g. new connection call vs. free'd up connection or call) that might help identify or at least narrow down the root cause of this? I'm not asking anyone to do the work for me, but please help steer me in a direction that might result in a finding that can be useful to everyone. Thanks in advance.
