BlueIris on Proxmox VM - cpu up and down?

Pentagano

Getting comfortable
Dec 11, 2020
664
299
Uruguay
Hi,

Been trying BlueIris out on many different platforms over the years.
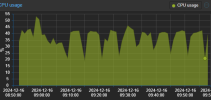
Been on proxmox for a while, but I always see these spikes and drops in cpu , even without camera activity, just recording on.
Thought it was windows defender scanning so span up a torn down version without windows defender on proxmox and still see these.
Is this normal Blueiris behaviour or something going on with my VM? Although it is not isolated as I have tested win10, win11 and ones without defender running.
When it was on a dedicated windows pc and do not recall these dips and spikes. Maybe a trait of being on proxmox? No idea at the moment

Any ideas?

Related with the zfs pool (mirrored)? Or thin-provisioning?

zfs can use a lot of cpu? I know it uses ram but thought it would not effect cpu like this. Will spin up a non zfs node and compare

Thanks

1734354736168.png
 
Last edited:
does it change when you disable BI?
Qemu Agent and Virtio drivers installed?
what hardware (disks) are in use, maybe something with SMR?
CPU Type for the VM is set to "host" ?
 
How many cores had you assigned to the VM? I'm assuming it is 5 and that the CPU usage spikes therefore are the result of one thread getting busy.

It seems very unlikely this is a consequence of virtualization. Based on that graph it looks like precisely every 6 minutes something causes CPU usage to drop briefly. Did you run Performance Monitor or something else that graphs CPU usage on a per-process level within Windows to see if it is definitely Blueiris.exe experiencing the usage changes, as opposed to other processes? Do note that Windows's CPU usage measurement tools are pretty much garbage anymore; you can get wildly different numbers depending on where you read the usage from, so it would be good if you had a graph of both overall CPU usage and Blueiris.exe usage to make sure all the major spikes happen in both lines at the same time.

I would look at Blue Iris's log file to see if there is any corresponding action in there that could explain it. For example I looked at my own CPU usage graphs and I see occasional upward spikes that appear to max out one CPU core for 30 seconds or so, and my log file reveals that at the end of the 30 seconds of CPU elevation, my doorbell cam logs Signal: network retry and Signal: restored. My doorbell cam is connected with wifi, so unreliability is to be expected and I frequently witness it "lose signal". The CPU usage spikes are the unexpected part, but I am too lazy to report this to Blue Iris support I think. Anyway I run BI on bare metal and in virtual machines and I've never seen a meaningful difference in behavior between them so I doubt this is related to virtualization. I don't know how having ZFS as the underlying file system on the hypervisor would do anything to guest CPU usage so I doubt that is related.
 
CPU levels out to normal after stopping BI service.

Should I change cpu type to host?

1 socket 4 cores. i3 7th gen. Nothing else running on this node except for an lxc uptime kuma.

zfspool made up of 2 ssd drives. Recording points to mapped drives elsewhere on the network. IO is low and stable.

Will spin up another stand alone pve node with a simple ext4 also I have a spare windows mini lenovo. Want to see if I can pinpoint these peaks and troughs which seem to be consistent..

1734370679665.png
 
Last edited:
Setting CPU type to host probably won't affect this either but it does not hurt.

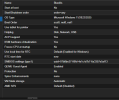
That memory allocation of 2.5 GiB is really low even if you've modded Windows to trim the fat. Does your node have enough RAM that you could allocate more to see if it makes a difference?
 
Setting CPU type to host probably won't affect this either but it does not hurt.

That memory allocation of 2.5 GiB is really low even if you've modded Windows to trim the fat. Does your node have enough RAM that you could allocate more to see if it makes a difference?
windows is trimmed, only uses 1.7GB memory at most
 
is the recording really an mapped drive or maybe a local one with a storage move job in BI?
 
windows is trimmed, only uses 1.7GB memory at most
I would still try with more memory allocated if possible (i'm guessing you don't have much available though). And I'd also not assign all 4 cores to one VM as it seems like that would introduce a high probability that the VM would have to spend a lot of time waiting for the entire CPU to be available before it could be scheduled to run. I'd try 3 cores and see if that helps at all.
 
  • Like
Reactions: Pentagano
I would still try with more memory allocated if possible (i'm guessing you don't have much available though). And I'd also not assign all 4 cores to one VM as it seems like that would introduce a high probability that the VM would have to spend a lot of time waiting for the entire CPU to be available before it could be scheduled to run. I'd try 3 cores and see if that helps at all.
Will try that for sure thanks, but I've always used 1 socket 4 cores on other pve nodes, standalone with different file systems and am sure this is something new

1734371456228.png
 
Tried different amounts of cores and memory. Worse.
Will try on another stand alone node and/or windows. Got bothe spare, just to eliminate that it might be something with this cluster set up
 
Setting CPU type to host probably won't affect this either but it does not hurt.
Unfortunately I my case it does.

I am running several Windows and Linux VM under Proxmox 8.3.1, all set to host to get the best performance. All is running fine.
Unfortunately when I spinned up a new Windows VM with the setting "host" for testing of Blue Iris it crashed with a blue screen each time I started Blue Iris. Changing it to "x86-64-v3", what is the highest version I can use with my CPU, all ist fine.
 
It's definitely something up with your particular VM. You can see my Windows BI VM has the CPU holding steady:

Untitled.jpg
 
Myabe it's the i3 7th gen. I moved the VMt to another instance on my powerful i7 dell tower (32GB ram) proxmox stand alone backup node. Ran smoothly.
Tried 2 backups of BI, one on win10 Pro and another on 11.
Maybe the cpu, but it doesn't like this i3 7th gen mini lenovo possibly

Maybe remove the node from the cluster and swap it with the dell i7.
Was trying to save power as the 2 lenovo mini pc's only pull about 19w in total in the cluster.
Use the cluster as I have omada controller and some other important services on it
 
Fixed.
I think it was an unused VM which had 2 usb devices attached which didn't exist.
Well after I removed that all settled back to normal and the VM is siting at a nice 9%.
Very strange one.
 
  • Like
Reactions: AlwaysSomething